


Northern Virginia’s premium $1M to $2M home marketClosed sales by community, January 1 to October 2, 2026, compared with the same dates in 2025
4,164 houses and townhouses sold between $1 million and $2 million. Here is how each community compares with 2025.
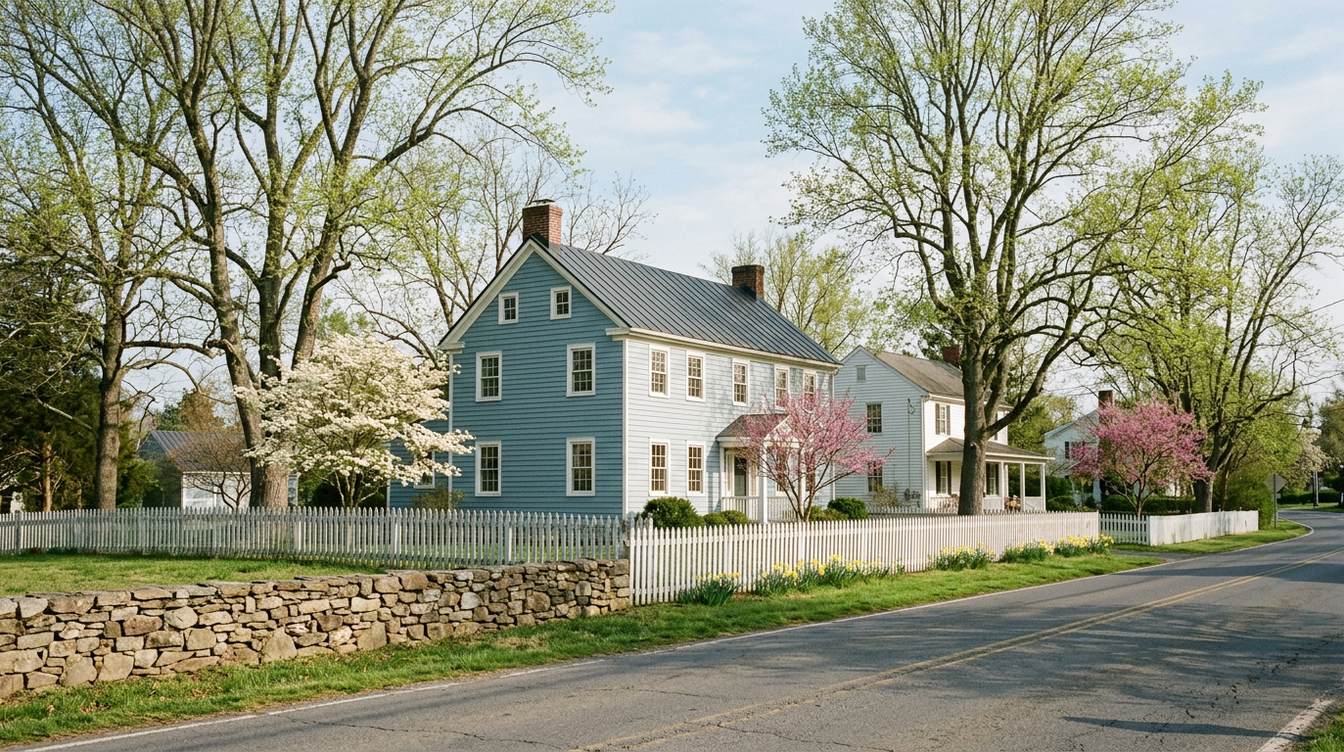
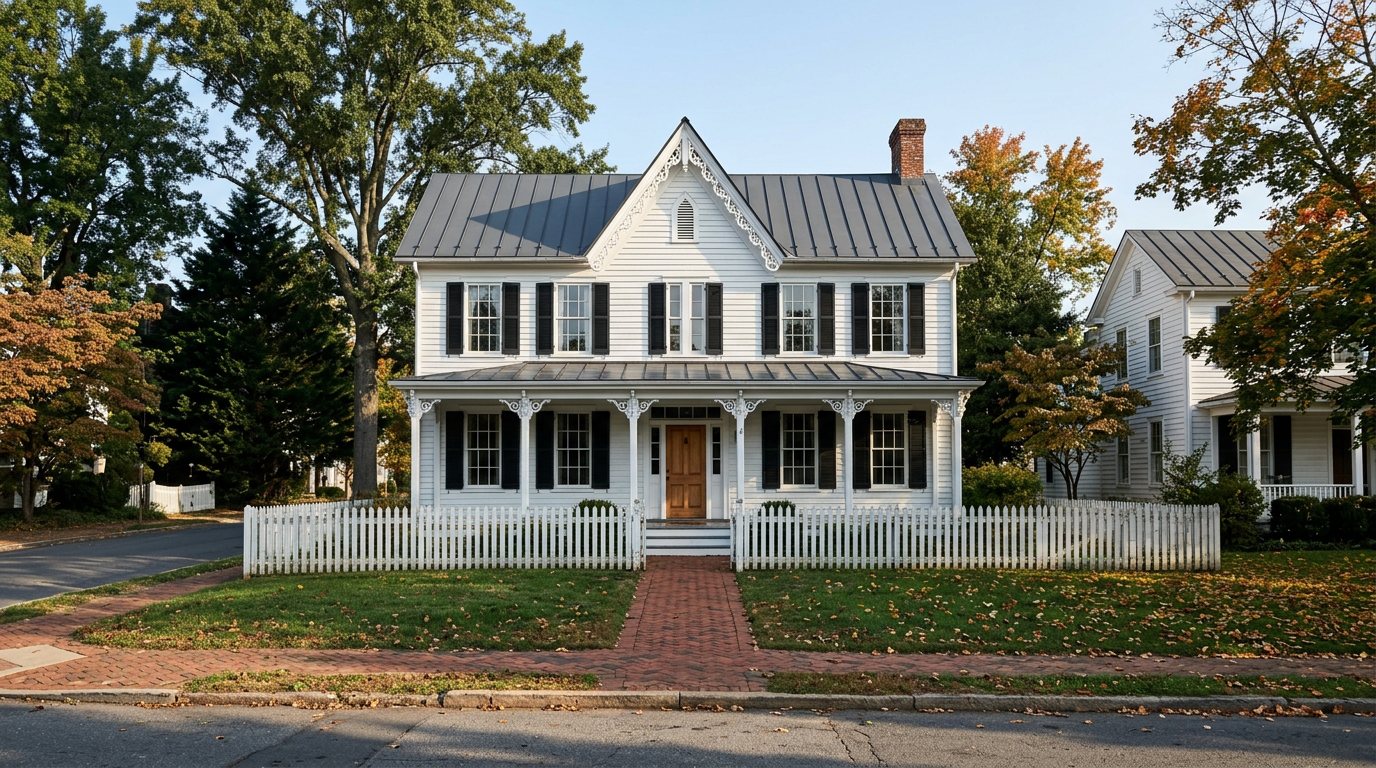
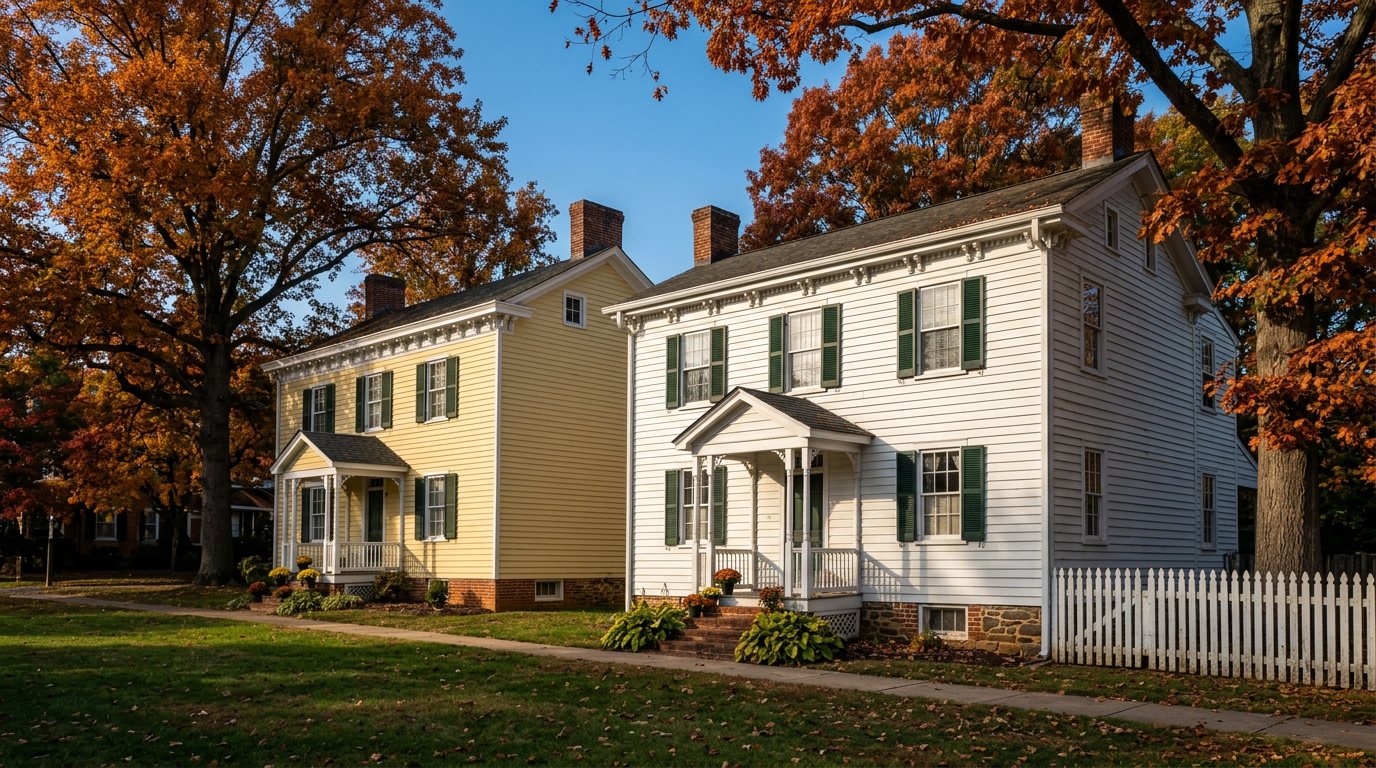
A stone manor in springMcLean, Fairfax County
Artist’s renderings inspired by real Northern Virginia settings, not listings.
Updated October 18, 2026Bright MLS closed salesAbout an 8-minute read
Quick answer
From January 1 to October 2, 2026, 4,164 single-family homes and townhouses sold for $1,000,000 to $1,999,999 in Northern Virginia, at a median of $1,273,000. The median home spent 6 days on the market, and 47.0% sold above the final list price. On the same dates in 2025, 4,086 sold at a median of $1,265,000, and 44.5% sold over asking, so the over-asking share rose 2.5 points.

The band, in four figures
★ Bright MLS closed sales, January 1 to October 2, 2026, compared with January 1 to October 2, 2025, single-family homes and townhouses sold for $1,000,000 to $1,999,999, condos left out; compiled by Ahmed Makkiyah.
Why this band
Between $1 million and $2 million, Northern Virginia has a market of its own.
For most move-up and premium buyers here, this is the market. From January 1 to October 2, 2026, 4,164 single-family homes and townhouses sold for $1,000,000 to $1,999,999. It covers a newer five-bedroom house in Loudoun and a renovated home close to the city. It moves at its own pace, and that pace changes from one community to the next.
This page measures closed sales only, not listings. I count detached houses and row townhouses, and I leave out condo-owned homes. I compare the same dates in 2026 and 2025. For each community I report how many homes sold, the median price, the median days on market, how often homes sold over or under the final list price, how often the price was cut first, and the median price per square foot.
Community by community
Where the band sold, place by place.
Arlington had the most sales in the band, with 473 from January 1 to October 2, 2026. Great Falls had the highest median in the band, at $1,525,000, followed by McLean at $1,475,000.
| ArlingtonArlington County | 473 | $1,330,000 | $1,342,813 | −1.0% | 6 | 51% | 29% | 14% | $644 |
|---|---|---|---|---|---|---|---|---|---|
| ViennaFairfax County | 293 | $1,362,000 | $1,375,000 | −0.9% | 5 | 56% | 24% | 12% | $526 |
| City of AlexandriaIndependent city | 278 | $1,325,000 | $1,325,000 | 0.0% | 6 | 40% | 27% | 15% | $645 |
| LeesburgLoudoun County | 273 | $1,275,000 | $1,286,316 | −0.9% | 5 | 49% | 30% | 17% | $364 |
| AlexandriaFairfax County | 265 | $1,204,000 | $1,200,000 | +0.3% | 6 | 41% | 32% | 14% | $435 |
| FairfaxFairfax County | 243 | $1,247,425 | $1,181,000 | +5.6% | 5 | 57% | 24% | 11% | $434 |
| AshburnLoudoun County | 171 | $1,275,000 | $1,240,000 | +2.8% | 6 | 47% | 29% | 9% | $375 |
| Falls ChurchFairfax County | 168 | $1,264,678 | $1,275,000 | −0.8% | 7.5 | 49% | 31% | 20% | $537 |
| McLeanFairfax County | 165 | $1,475,000 | $1,422,500 | +3.7% | 6 | 36% | 37% | 16% | $662 |
| RestonFairfax County | 158 | $1,200,000 | $1,150,000 | +4.3% | 5 | 51% | 21% | 13% | $468 |
| AldieLoudoun County | 150 | $1,345,829 | $1,327,504 | +1.4% | 6.5 | 35% | 39% | 27% | $390 |
| Fairfax StationFairfax County | 121 | $1,275,000 | $1,250,000 | +2.0% | 6 | 58% | 17% | 10% | $417 |
| HerndonFairfax County | 100 | $1,200,000 | $1,199,698 | +0.0% | 5 | 53% | 27% | 15% | $398 |
| HaymarketPrince William County | 97 | $1,249,000 | $1,200,000 | +4.1% | 8 | 31% | 49% | 19% | $317 |
| OaktonFairfax County | 95 | $1,375,000 | $1,400,000 | −1.8% | 5 | 59% | 23% | 21% | $489 |
| AnnandaleFairfax County | 78 | $1,152,500 | $1,100,000 | +4.8% | 6 | 60% | 30% | 12% | $454 |
| Great FallsFairfax County | 77 | $1,525,000 | $1,422,500 | +7.2% | 7 | 40% | 47% | 26% | $506 |
| SpringfieldFairfax County | 68 | $1,160,000 | $1,135,000 | +2.2% | 5 | 63% | 22% | 13% | $418 |
| South RidingLoudoun County | 66 | $1,263,500 | $1,158,050 | +9.1% | 6 | 44% | 35% | 12% | $360 |
| BrambletonLoudoun County | 64 | $1,200,000 | $1,200,000 | 0.0% | 8.5 | 28% | 41% | 19% | $364 |
| GainesvillePrince William County | 54 | $1,158,000 | $1,185,000 | −2.3% | 5 | 39% | 32% | 20% | $327 |
| CliftonFairfax County | 54 | $1,226,000 | $1,362,500 | −10.0% | 11 | 33% | 44% | 37% | $382 |
| City of Falls ChurchIndependent city | 54 | $1,339,922 | $1,399,500 | −4.3% | 6 | 52% | 28% | 11% | $556 |
| SterlingLoudoun County | 51 | $1,195,000 | $1,142,500 | +4.6% | 6 | 45% | 31% | 28% | $370 |
| BurkeFairfax County | 48 | $1,095,295 | $1,155,000 | −5.2% | 5 | 77% | 8% | 2% | $443 |
| CentrevilleFairfax County | 48 | $1,100,000 | $1,125,000 | −2.2% | 5 | 71% | 17% | 4% | $342 |
| PurcellvilleLoudoun County | 44 | $1,410,500 | $1,300,000 | +8.5% | 6.5 | 27% | 36% | 23% | $371 |
| ManassasPrince William County | 39 | $1,185,000 | $1,192,500 | −0.6% | 10 | 21% | 41% | 26% | $295 |
| BroadlandsLoudoun County | 36 | $1,172,500 | $1,217,500 | −3.7% | 4 | 69% | 11% | 3% | $368 |
| NokesvillePrince William County | 35 | $1,300,000 | $1,405,773 | −7.5% | 24 | 17% | 54% | 23% | $308 |
| City of FairfaxIndependent city | 35 | $1,210,000 | $1,233,461 | −1.9% | 7 | 37% | 43% | 17% | $393 |
| LortonFairfax County | 34 | $1,150,000 | $1,185,000 | −3.0% | 5.5 | 47% | 21% | 6% | $360 |
| Round HillLoudoun County | 33 | $1,275,000 | $1,286,500 | −0.9% | 5 | 36% | 36% | 30% | $348 |
| Chantillysmall sampleFairfax County | 29 | $1,270,000 | $1,210,000 | +5.0% | 4 | 79% | 14% | 10% | $406 |
| Hamiltonsmall sampleLoudoun County | 26 | $1,385,950 | $1,231,750 | +12.5% | 11 | 27% | 42% | 31% | $338 |
| Waterfordsmall sampleLoudoun County | 19 | $1,385,000 | $1,376,898 | +0.6% | 21 | 11% | 63% | 21% | $352 |
| Lovettsvillesmall sampleLoudoun County | 19 | $1,300,000 | $1,192,500 | +9.0% | 12 | 16% | 53% | 16% | $333 |
| Woodbridgesmall samplePrince William County | 12 | $1,130,000 | under 10 sales | n/a | 30 | 17% | 67% | 33% | $295 |
| Dumfriessmall samplePrince William County | 10 | $1,080,000 | $1,090,250 | −0.9% | 21 | 40% | 40% | 30% | $306 |
| MiddleburgLoudoun County | 9 | Too few sales to call (under 10) | |||||||
| BristowPrince William County | 4 | Too few sales to call (under 10) | |||||||
| TrianglePrince William County | 0 | Too few sales to call (under 10) | |||||||
| City of ManassasIndependent city | 0 | Too few sales to call (under 10) | |||||||
Tap a column name to sort. Swipe the table sideways on a phone.
Each row covers qualifying sales from $1,000,000 to $1,999,999, January 1 to October 2, 2026, with the median for the same dates in 2025. Days are median days on market. Over and under compare the closed price with the final asking price. Price cut is the share of sales whose asking price was lowered before the sale. Price per square foot uses above-grade finished area only. Places with 10 to 29 sales are marked as a small sample; under 10 are too few to call. The 43 rows hold 4,096 of the 4,164 sales; the other 68 were in smaller places with no page in this guide and count only in the regional figures. Source: Bright MLS closed sales, compiled by Ahmed Makkiyah.
For buyers
Where sales conditions differed.
Only communities with 30 or more qualifying sales are compared here. These differences show where to look closely at competition and pricing. They do not predict the outcome for any one home.
- More sales above asking. The highest shares of sales above the final asking price were in Burke (77% of 48 sales, median 5 days on market), Centreville (71% of 48 sales, 5 days) and Broadlands (69% of 36 sales, 4 days). A high share does not mean every home there drew competing offers.
- More sales below asking, or more price reductions. In Nokesville, 54% of 35 sales closed below the final asking price, with a median of 24 days on market. In Clifton, 37% of 54 sales had a price reduction (median 11 days), and in Round Hill 30% of 33 sales. A sale below asking does not by itself show how much a buyer negotiated or saved, and a longer time on market does not by itself mean a home was overpriced.
- Price per square foot varied widely. Among communities with 30 or more sales, the median price per above-grade square foot ran from $295 in Manassas, $308 in Nokesville and $317 in Haymarket to $644 in Arlington, $645 in the City of Alexandria and $662 in McLean. It is a broad measure. Home type, age, lot size, condition and finished basements all move it, so the lowest figure is not automatically the best value.
For buyers
Planning to buy a $1M to $2M home in Northern Virginia?
Explore actual sales across Northern Virginia communities. When you're ready, let's talk about which areas fit your budget, priorities and plans.
For sellers
What sellers can learn.
- The region moved quickly. The median qualifying sale spent 6 days on market in both years. 47.0% sold above the final asking price, compared with 44.5% on the same dates in 2025, a rise of 2.5 percentage points. These are regional results, not a forecast for any one home.
- Price reductions varied by community. 15.6% of qualifying sales had a price reduction before closing, compared with 17.5% in 2025, 1.9 percentage points lower. Among communities with 30 or more sales, the share ran from 2% in Burke to 37% in Clifton. A high or low share does not by itself show whether homes were priced well. Comparable closed sales, competing listings, condition and the gap between the original and final asking price give a sounder base for a pricing plan.
- Townhouses and houses sold at different prices. 416 townhouses sold in the band at a median of $1,200,000 and $531 per above-grade square foot. 3,748 houses sold at a median of $1,280,500 and $429 per above-grade square foot. I compare a townhouse with townhouses and a house with houses, in its own community. These figures describe past sales. They do not promise any result for your home.
Houses and townhouses
Two kinds of home, side by side.
Houses made up 3,748 of the 4,164 sales in the band from January 1 to October 2, 2026. Townhouses were fewer and smaller, but cost more per square foot. Townhouse sales went from 454 to 416 between the two periods, and the townhouse median went from $1,175,000 to $1,200,000.
| Kind | Sales 2026 | Median price | Median days on market | % over asking | % with a price cut | Median price per sq ft | Median size (sq ft) | 2025 sales and median |
|---|---|---|---|---|---|---|---|---|
| Single-family houses | 3,748 | $1,280,500 | 6 | 47.6% | 16.1% | $429 | 2,985 | 3,632 sales, $1,275,000 |
| Townhouses | 416 | $1,200,000 | 6 | 41.6% | 11.3% | $531 | 2,360 | 454 sales, $1,175,000 |
How I did it
Exactly what is measured.
- Source and dates. Bright MLS closed sales that I pulled myself (the 2026 file on October 6, 2026). Closed January 1 to October 2, 2026, compared with the same dates in 2025, January 1 to October 2, 2025.
- Which homes count. Detached houses with at least 3 bedrooms and 2 full bathrooms, plus interior-row and end-of-row townhouses. The bedroom and bathroom rule applies to detached houses only. Condominiums and condo-owned homes are left out: any home with a condo or co-op association, or with condominium or co-op ownership. This report does not cover every property sold in the price range.
- Price band. Set by the closed sale price, from $1,000,000 to $1,999,999. A sale at $2,000,000 is left out. A home first listed at $2 million or more counts if it closed inside the band (52 sales in 2026 and 39 in 2025 did). The report does not describe every home first marketed at $1 million to $2 million.
- Each sale counts once. Duplicate MLS numbers are removed (there were none). No qualifying sale was missing a price, a list price or days on market.
- Above, at or below asking. The closed price compared with the final asking price on the listing that closed, not the original asking price. Every qualifying sale falls in exactly one of the three groups: 47.0%, 22.9% and 30.1% in 2026, and 44.5%, 22.3% and 33.3% in 2025 (the shown shares can total 100.1% because of rounding).
- Price reduction. The share of qualifying sales whose final asking price was lower than the original asking price on the same listing. A sale counts once, however many reductions it had. If a home was taken off the market and relisted at a lower price, the new listing starts a new original price, so that reduction is not counted. 6.7% of 2026 sales and 6.9% of 2025 sales had an earlier listing.
- Days on market. The MLS days-on-market figure for the listing that closed. Counting the days of earlier listings too (cumulative days on market) still gives a median of 6 days in both years.
- Price per square foot. For each sale, the closed price divided by its above-grade finished square feet; the figure shown is the median of those. Finished basements are not in the area, so homes with large finished basements show a higher figure. Sales with no area recorded, or 400 square feet or less, are left out of this measure only (13 in 2026, 47 in 2025). It is a broad comparison, not a substitute for comparing similar homes.
- Communities. Labels follow the grouping used across this guide: one county plus the postal city, with the independent cities on their own. Postal-city names do not always match town limits or the neighborhood names people use. Homes in Loudoun County with a Chantilly mailing address count as South Riding, and Chantilly in the table is the Fairfax County side.
- Sales outside the 43 rows. The 43 rows hold 4,096 of the 4,164 qualifying sales in 2026 and 4,020 of 4,086 in 2025. The other 68 (66 in 2025) were in smaller places with no page in this guide, such as Oak Hill, Hillsboro and Dunn Loring. They are included in every regional figure but are not assigned to a row.
- Sample sizes. A community gets a median only with 10 or more sales. With 10 to 29 it is marked as a small sample and left out of the comparisons above. Under 10 is too few to call. The 30-sale line is a reporting rule to reduce unstable comparisons, not a test of statistical significance, and none of the differences here were tested for significance.
- What this report does not show. It covers January 1 to October 2 of each year, not a full year. It describes homes that closed, not homes for sale now. Community figures describe groups of sales, not the likely result for any one home, and a small sample can move a percentage by several points. A change in a median can come from a different mix of homes selling, so it is not the change in any one home’s value.
Questions
Questions on the $1 million to $2 million market.
How many homes sold for $1 million to $2 million in Northern Virginia in 2026?
From January 1 to October 2, 2026, 4,164 single-family homes and townhouses sold for $1,000,000 to $1,999,999, in Bright MLS closed sales compiled by Ahmed Makkiyah. On the same dates in 2025, 4,086 sold. Condo-owned homes are left out of both counts.
What is the median price of a $1M to $2M home in Northern Virginia?
The median sale price in the band was $1,273,000 from January 1 to October 2, 2026, compared with $1,265,000 on the same dates in 2025, per Bright MLS closed sales. Houses had a median of $1,280,500 and townhouses $1,200,000 in 2026.
How fast do $1 million homes sell in Northern Virginia?
The median home in the band spent 6 days on market from January 1 to October 2, 2026, the same as on those dates in 2025, per Bright MLS closed sales. Some places were slower: Nokesville had a median of 24 days across 35 sales, and Clifton 11 days across 54.
Where do $1 million homes sell over asking most often?
Among places with 30 or more sales from January 1 to October 2, 2026, Burke led with 77% of sales over the final list price, then Centreville with 71% and Broadlands with 69%, per Bright MLS closed sales.
Do luxury homes in Northern Virginia get price cuts?
Some do. From January 1 to October 2, 2026, 15.6% of sales in the $1,000,000 to $1,999,999 band had a price cut before they sold (17.5% on the same dates in 2025), and 30.1% closed under the final list price, per Bright MLS closed sales. Clifton had the highest share of cuts among places with 30 or more sales, at 37%.
Which Northern Virginia communities have the most $1M to $2M sales?
From January 1 to October 2, 2026, Arlington had the most, with 473 sales in the band, per Bright MLS closed sales. Next came Vienna with 293, the City of Alexandria with 278, Leesburg with 273 and Alexandria in Fairfax County with 265.
How the details are verified
In this band, I price from closed sales, not from averages.
I have been a real estate agent since 2014, first in Michigan, and licensed in Virginia since 2019. The Northern Virginia Association of REALTORS (NVAR) named me a Top Producer every year from 2020 to 2025.
For this report I ran the Bright MLS search myself, with the same filters and dates for both years. I removed duplicates by MLS number and matched each sale to its place the same way my town pages do. I report counts and medians only, never an address.
On a specific $1M to $2M home, I start with that community's own closed sales. Then I look at the competing listings, the condition and the features that set the home apart. I walk you through every comparable sale before we set or offer a price. The numbers guide the decision. They do not promise a result.
Your next step
A $1M to $2M move, planned with care.
Tell me the community and whether you are buying, selling or both. I will reply personally with that place's own closed sales in the band and what they mean for your plans, in English or Arabic.
Further reading
The market report, the luxury series and the busiest communities in the band.
The NoVA Index
The whole market, month by month, from my own MLS pulls.
Read the report Luxury seriesLuxury in Northern Virginia
Estates, horse country, wine and golf.
Back to the series Luxury seriesThe estate towns
Where land and privacy set the price.
Read the guide Luxury report$2M+ homes
The band above: 824 sales of $2 million and up in 2026.
Read the report Most sales in the bandArlington
473 sales from $1M to $2M in 2026.
Open the guide Fairfax CountyVienna
293 sales from $1M to $2M in 2026.
Open the town guide Loudoun CountyLeesburg
273 sales from $1M to $2M in 2026.
Open the town guide Fairfax CountyMcLean
The highest price per square foot in the band.
Open the town guide Fairfax CountyGreat Falls
The highest median in the band.
Open the town guide Home valuationPriced on evidence.
Comparable closed sales near you, matched on land as well as house.
Get a valuationKeep reading
- Luxury seriesLuxury in Northern VirginiaEstate country, private clubs and hunt-country weekends.
- Luxury series$2M+ luxury homes by community824 sales of $2M and up in 2026: median price, days and price tiers in every community.
- Luxury seriesThe estate townsWhere the $2 million and acreage homes sell, town by town.
- Monthly reportHousing market reportThe NoVA Index: what homes sold for, month by month.